100+ conference rooms, finally visible.
At Bridgestone, an audio-visual failure could surface as a complaint from a meeting already in progress, the support team learning a room was down from the people sitting in it. Across 100+ conference rooms and roughly 2,500 devices, floor staff needed room-level status and leadership needed a fundable replacement plan. We connected both to the same asset records.
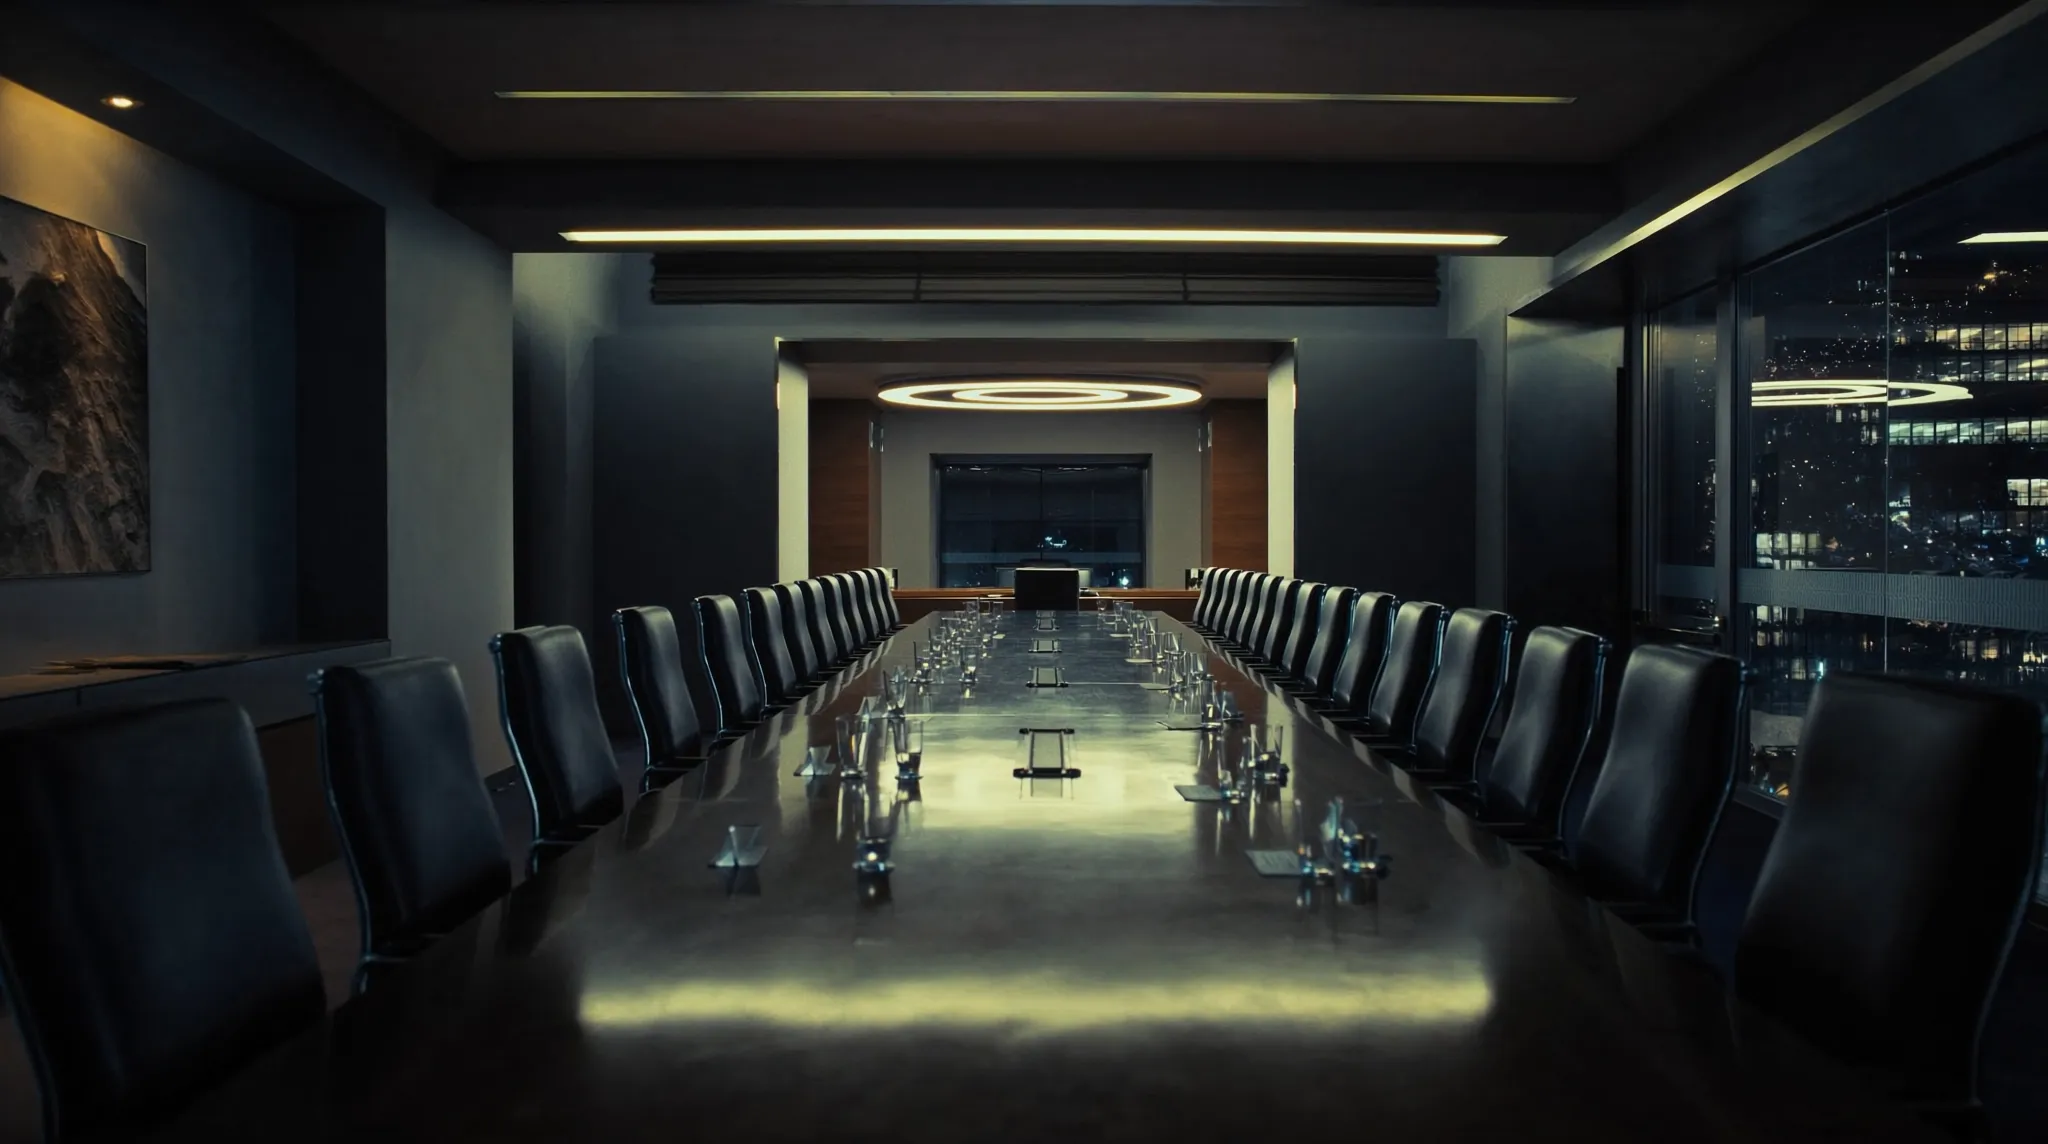
The ask was room status. The real work was the whole AV estate.
An AV failure could reach the support team as a complaint from a meeting already in progress, the room learning it was down from the people sitting in it. Across 100+ conference rooms and roughly 2,500 devices, floor staff needed room-level status and leadership needed a fundable replacement plan, both built from records that lived only in engineering drawings and purchase files.
One estate, two ways in
A room that answers for itself at the door, and the whole device estate behind one asset record.
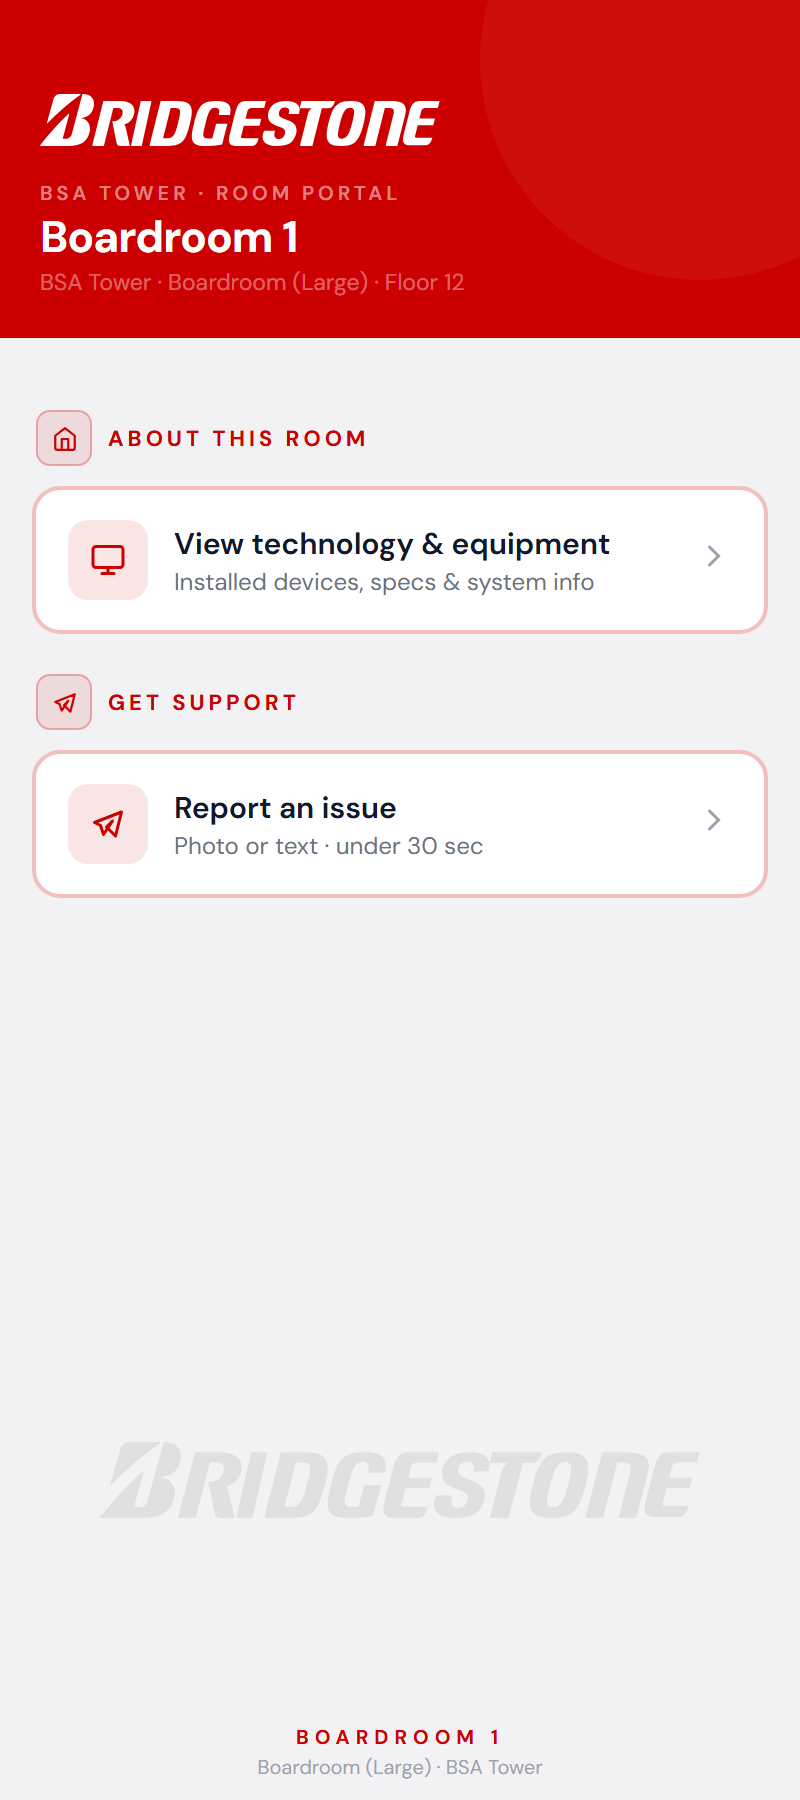
Every room answers for itself
A QR code at the door opens the room's portal: what is installed, whether it is online, and one tap to report a problem, connected to a live monitoring platform.
What changedChecking a room is a scan, not a site visit or a help-desk call.
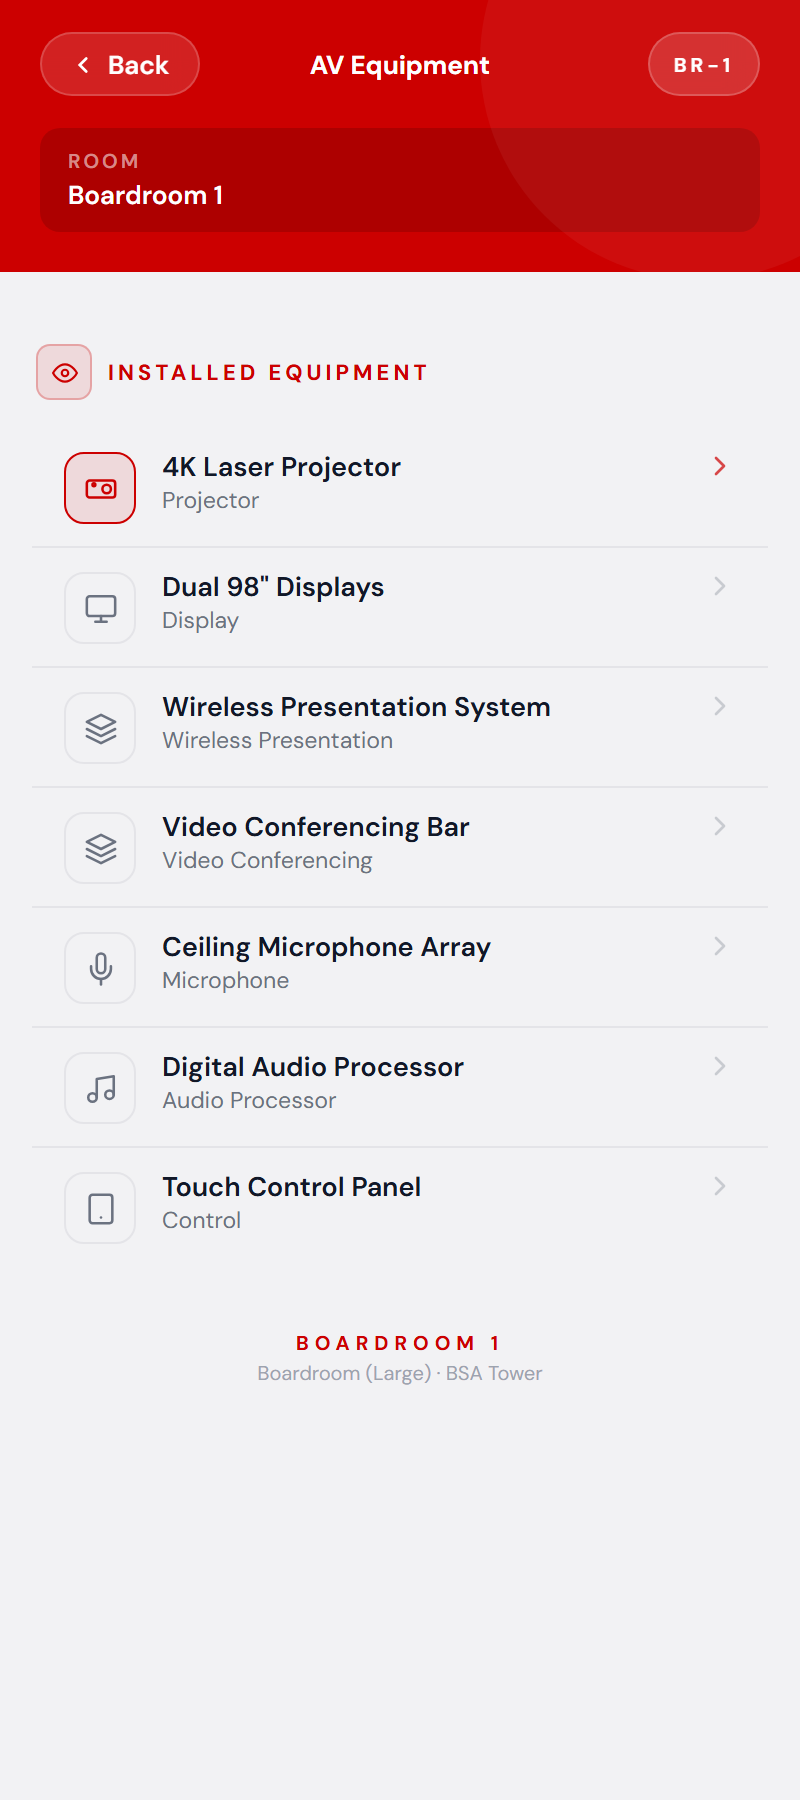
The whole AV estate, one asset record
Every device in every room, with its specs and status, pulled out of engineering drawings and purchase files into one library that feeds depreciation, end-of-life, and end-of-service-life planning.
- Location, cost, and age for all ~2,500 devices land in one map to plan against.
- Depreciation, EOL, and EOSL tracking turns a wishlist into a fundable, prioritized refresh plan.
What changedLeadership stopped reconstructing the estate from drawings and receipts.
Failures surface before the meeting does
The point was not a prettier inventory. It was catching a dead room before someone sitting in it had to.
- The room app reads live online and offline status from a monitoring platform, so a down device is visible before a meeting starts.
- Status changes fire email and text alerts, giving the support team a second path to catch an issue.
- A ticket opens straight from the room view, carrying the room and the equipment context with it.
What the connected view produced
One asset record made the estate useful for both room support and capital planning.
- Room status went from a site visit to a scan: every conference room answers in seconds with live status.
- Location, cost, and age for all ~2,500 devices landed in one map for leadership to plan against.
- Depreciation, EOL, and EOSL records supported a prioritized replacement plan instead of a reactive one.
What the approach changed
We connected information the business already held, in drawings, purchase records, and the monitoring platform, into one place staff and leadership could act on. Floor teams gained room-level context; leadership gained a view of what to replace and when. The useful step was making existing information easy to find and trust, not buying a new system to hold it.
